
Figure 1: Happy little storage buckets made of star stuff.
I store all of my critical data in ZFS and replicate it offsite nightly with zrepl.
The monitoring page of the zrepl docs mock me with:
Monitoring endpoints are configured in the
global.monitoringsection of the config file. […] zrepl can expose Prometheus metrics via HTTP.
Without the ability to fire commands after replication completes, this monitoring solution is my only option for backup situational awareness. I suppose I need to collect and alert on metrics now? Because they told me to? That's fine; scraping Prometheus metrics is like riding a bike for an SRE. We all learn how to do it shortly after learning how to deliver our first rant about systemd.
The only wrinkle in my grandiose plan is that I fucked up my old Prometheus deployment (call me Perplexity because I can't scrape right). Two human children joined our family years ago and I didn't have any more free time to fix it.
I've got self-imposed constraints: in my lab one of my guiding architectural design principles is to build in fault-tolerance for maximum resiliency for everything1.
Dropping a prometheus.service onto a host or into Nomad and configuring a zrepl scraping endpoint violates this: Prometheus data is only saved to one place and configuration file endpoints are static – I can't migrate services around if machines go down and a dead disk would screw me over.
In this blog post I'm going to explain what I built to support a highly-available observability setup in my lab for Prometheus timeseries data.
Maybe it'll be helpful for SREs who are short on stupid ideas profound inspiration.
Table of Contents
An architectural chiasmus of pain

Figure 2: REPLICATED STORAGE FOR OTLP FOR PROMETHEUS FOR SCRAPERS FOR BACKUPS, BROTHERRR
First I'll walk down the dependency chain to provide an overview, then provide more details building up to the solution:
zreplexposes Prometheus metrics I need to gain visibility into my backups. I don't have operational Prometheus (yet).- I need to run a collector to acquire my metrics. Something like Prometheus needs to store that data and I do not want to put the data onto a single disk and thus a single point of failure.
- Native Prometheus isn't distributed, so I need to run an agent somewhere that is clustering-capable.
There's two parts to this:
- The agent itself needs to be clustering-aware so that it can die without disrupting my metrics collection.
- The agent needs to store data in a replicated way so that losing a disk doesn't mean I lose data.
- The storage layer can rely on the layer above it to replicate data around or do so itself.

Figure 3: The golden path
Let's start our operational misadventures where I'll eventually store bits for zrepl metrics on-disk.
Layer 0: bits onto spinning platters

Figure 4: Ganglia died so that I may live
The Prometheus remote write protocol provides for the convenient property that your storage layer may be decoupled from other observability layers: as long as inbound metrics wrapped in this "write protocol" get stored reliably, we don't have to sweat data loss.
As mentioned in the preceding paragraphs, you can deal with the "single disk point of failure" problem in one of two ways:
- Rely on your remote write daemon to replicate across the backend storage it knows about.
- Store data somewhere that natively replicates data.
Option number 1 is probably easier, but I've been meaning to retire my decrepit MinIO deployment with something better, and this was the kick in the ass I needed to finally do it.2
Turns out that garage is a very nice S3-compatible object storage implementation system (like MinIO). As an added bonus, it's written in Rust, so it's memory-safe and also enrages all the brain dead software engineering influencers who love to hate the language. Win-win!
I won't go deep into the method for deploying it here; the docs are very good. NixOS has a native module for garage, which made it especially easy for me. My particular setup ended up with a garage deployment that looks like:
- Six servers deployed across
aarch64ODroid HC4 machines - Clustering via consul
- Replicated layout to mitigate hardware failures
My tl;dr review of garage is that it's a fine replacement for MinIO and it's working well for my needs.
That's the storage layer solved, now we need to built out the remote write layer.
Layer 1: turning metrics into bits

Figure 5: How much mi could mimir mir if mimir could mir mi
The observability ecosystem around Prometheus is mature at this point, you have numerous options for distributing data read and write operations (Thanos, for example). I went with Grafana mimir because it can remote write to S3-compatible endpoints (like garage), cluster with other instances over Consul, and I was planning on using this system with Grafana anyway.
Wouldn't you know it: NixOS supports mimir natively so this was also pretty easy.
Configure mimir with garage credentials, consul connectivity, and let garage deal with data replication.
Now I can hit mimir.service.consul anywhere in my lab network to read and write to a load-balanced metrics data storage layer with replicated blocks.
👉 See this section for more about how I'm registering services for DNS discovery.
Layer 2: acquiring metrics

Figure 6: Oh boy I'm excited for another industry standard oh boy
We need to ingest metrics into mimir now that there's a generally-available endpoint in the lab that'll accept remote-write protocol payloads.
The de facto solution for this is the OpenTelemetry collector. I haven't built large-scale observability platforms for a while now, but – for some reason – people keep building distributions of this software? Elastic does it and Grafana does it. I say this for no other reason than it kind of annoys me.
In any event, we can run the vanilla, upstream collector, and do so without any need for persistent data because the only thing it'll do is scrape endpoints defined in a configuration file and write the results out to mimir. Stateless is good.
My own unique deployment – once again – relies on Consul to avoid manual configuration:
YAML- Font used to highlight comments.
- Font used to highlight strings.
- Font used to highlight property references. For example, property lookup of fields in a struct.
receivers:
  prometheus:
    config:
      scrape_configs:
        - job_name: 'consul'
          consul_sd_configs:
            - server: '172.17.0.1:8500' # Talk to the container
                                        # host's forwarded consul port
              services: # Scrape each of these
                - telegraf
                - zrepl
              scheme: http
          relabel_configs:
            - source_labels: [__meta_consul_tags]
              regex: .*
              action: keep
            - source_labels: [__address__]
              target_label: instance
            - action: labelmap
              regex: __meta_consul_service_metadata_(.+)
Because I'm registering zrepl and telegraf into my lab Consul deployment, I have zero static hostnames or IP address in my configuration file.
opentelemetry-collector just discovers the hosts.
The fact that the configuration is so dynamic lends itself well to my lab design in which many cheap hosts can come up or down willy-nilly as a need to replace hardware when it inevitably fails in the middle of a movie in Jellyfin.
Layer 3: announcing metrics

Figure 7: Remember the CAP theorem?
I run services in my lab in one of two ways (generally):
- Static services tied to a host (think: a NixOS module defines and runs
garage.serviceon a host with large disks) - Dynamic services that "float" around my Nomad cluster (in any other situation, these would be Kubernetes workloads, but I run an alternative container orchestrator to be contrarian)
I often give services in the first category a sidecar service that will "announce" the availability of the service across the Consul cluster. This actually serves a variety of purposes – for example, my reverse proxy can discover HTTP listeners and dynamically allocate a new site in Caddy for me (see this post for more about that).
In this particular case, once zrepl comes online, it self-registers its metrics endpoint and opentelemetry-collector performs service discovery to find the host and port to find zrepl metrics at.
The actual sidecar is very simple – here's a simplified version:
consul services register -address=$(ifdata -pa mesh) -name=zrepl -port=9811
My actual systemd services are templated and the network address is discovered based on my encrypted network mesh.
This finds the host's private lab wireguard mesh network IP address and self-registers a service called zrepl reachable at port 9811.
opentelemetry-collector will handle the rest.
Layer 4: pretty graphs
What's the end result?
Visibility into all zrepl activity:
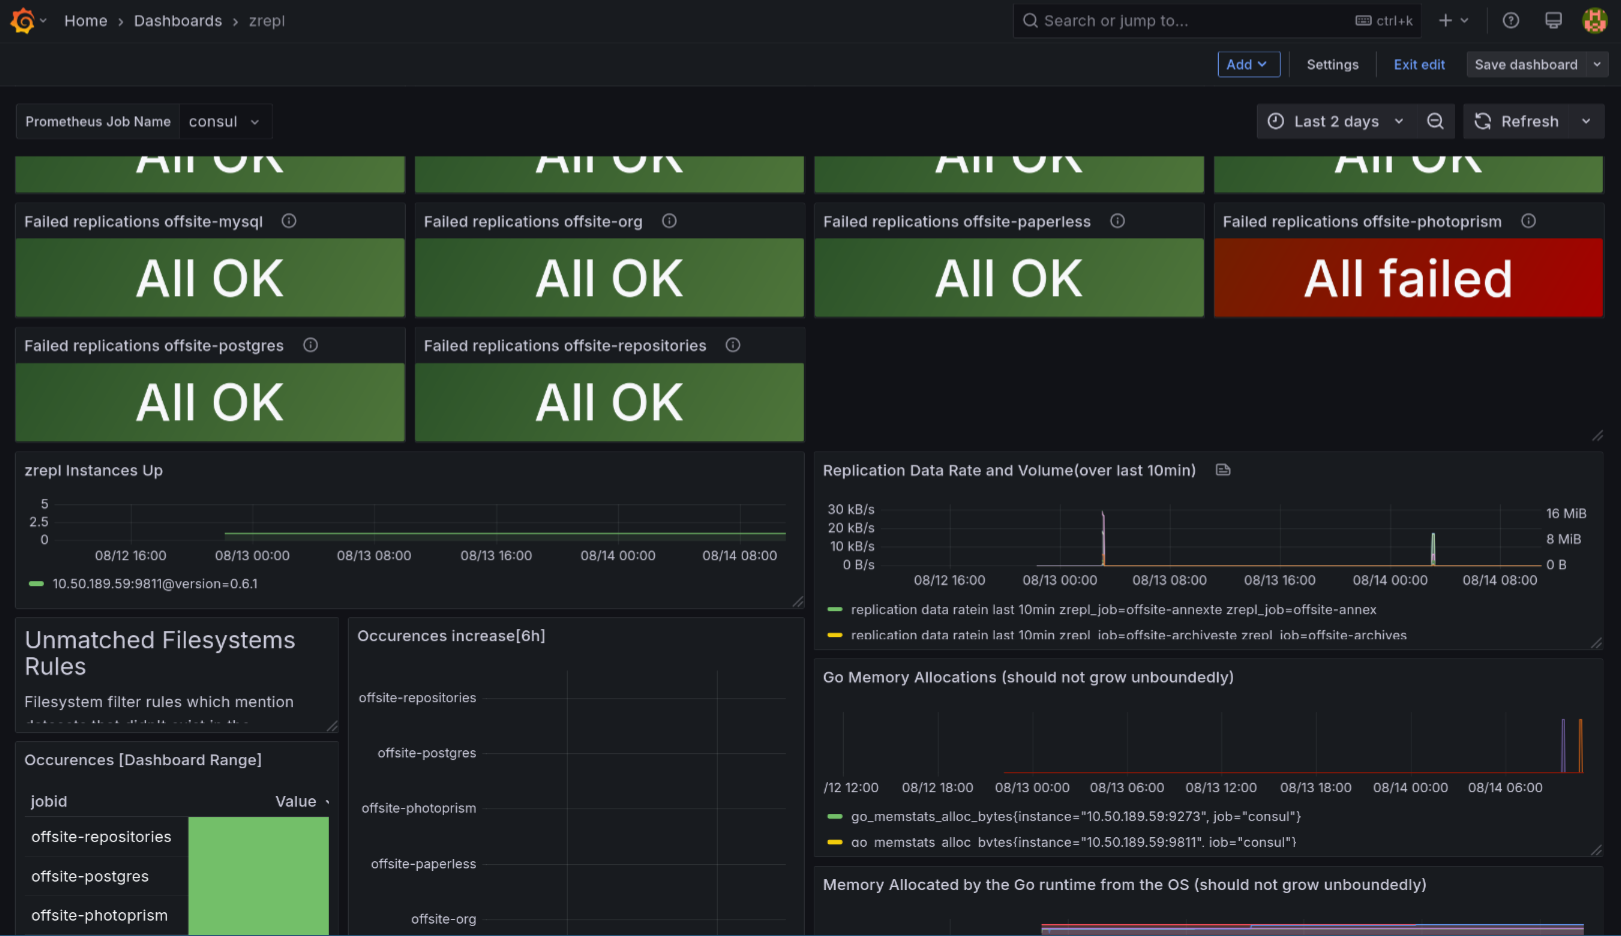
Figure 8: The zrepl Grafana dashboard
- Overview of recent failures for each job (apparently my Photoprism dataset needs attention)
- Data transfer volume per-job timeseries graphs
- Other low-level diagnostics like runtime
goinformation
We made it. I'm still in the process of wiring up alerts to this system, but all of the data is finally there and I have visibility now. Both Grafana and Mimir can facilitate alerting, so that part shouldn't be hard.
📊 Grafana also self-registers with Consul to expose itself in my lab's reverse proxy/HTTP setup with Caddy and talks to the load-balanced mimir.service.consul name to serve as its metrics backend.
Unsolicited opinions

Figure 9: BUCKLE UP SON, SOME HACKER NEWS COMMENTERS MIGHT DISAGREE WITH YOU
<extremely ChatGPT voice> You absolutely nailed reading this far into the blog post. Here's the key findings for this project3:
- Consul is my homelab MVP. It facilitates clustering for both mimir and garage, enables auto-discovery for service metrics, and completely removes any concerns about finding where to hit a service endpoint with ad-hoc names like
foo.service.consul. I would 100% use Consul again for its features if I was doing any sort of clustering work like this.4 - I continue to be impressed by the flexibility and utility of
opentelemetry-collector. The breadth ofreceiverandexporterplugins is vast and it mostly Just Works®. I have future plans to attempt to aggregate all of my labjournaldlogs for storage in Loki or Elasticsearch, but that's a bigger undertaking than doing so for timeseries data. Self-hosted object storage is pretty mature and easy to deploy at this point in history. MinIO is the Big Dog™ but other, smaller players like garage are also good and unlock a lot of capabilities.
I haven't written about it here, but I also use garage to serve as the backing store for my homelab's container registry and to host a few static sites. It continues to serve well in that capacity after it dethroned MinIO and sent it to the shadow realm.
Scream at me on Twitter or Mastodon if you have questions or comments about the setup (or comment below).
Footnotes:
Generally I'm trying to build a lab that is easy to scale horizontally and, by virtue of how you build infrastructure that scales out, it should also be easy to build in failover.
I also try to use commodity hardware (hence lots of aarch64 single-board computers) and smaller buildings blocks of infrastructure (like wireguard, Caddy, and GlusterFS) rather than do-it-all software (like Kubernetes or Ceph).
💣 I was annoyed at MinIO after the force-imposed gateway migration and then swore it off after their licensing switcheroo.
No, I didn't use an LLM to write this blog post. Do you think so little of me?
I realize that most modern infrastructure is going to deploy Kubernetes and forget about it. In my lab, we live in the romantic era of DevOps/SRE when we build novel systems out of robust building blocks and we liked it.